


WHAT is it?
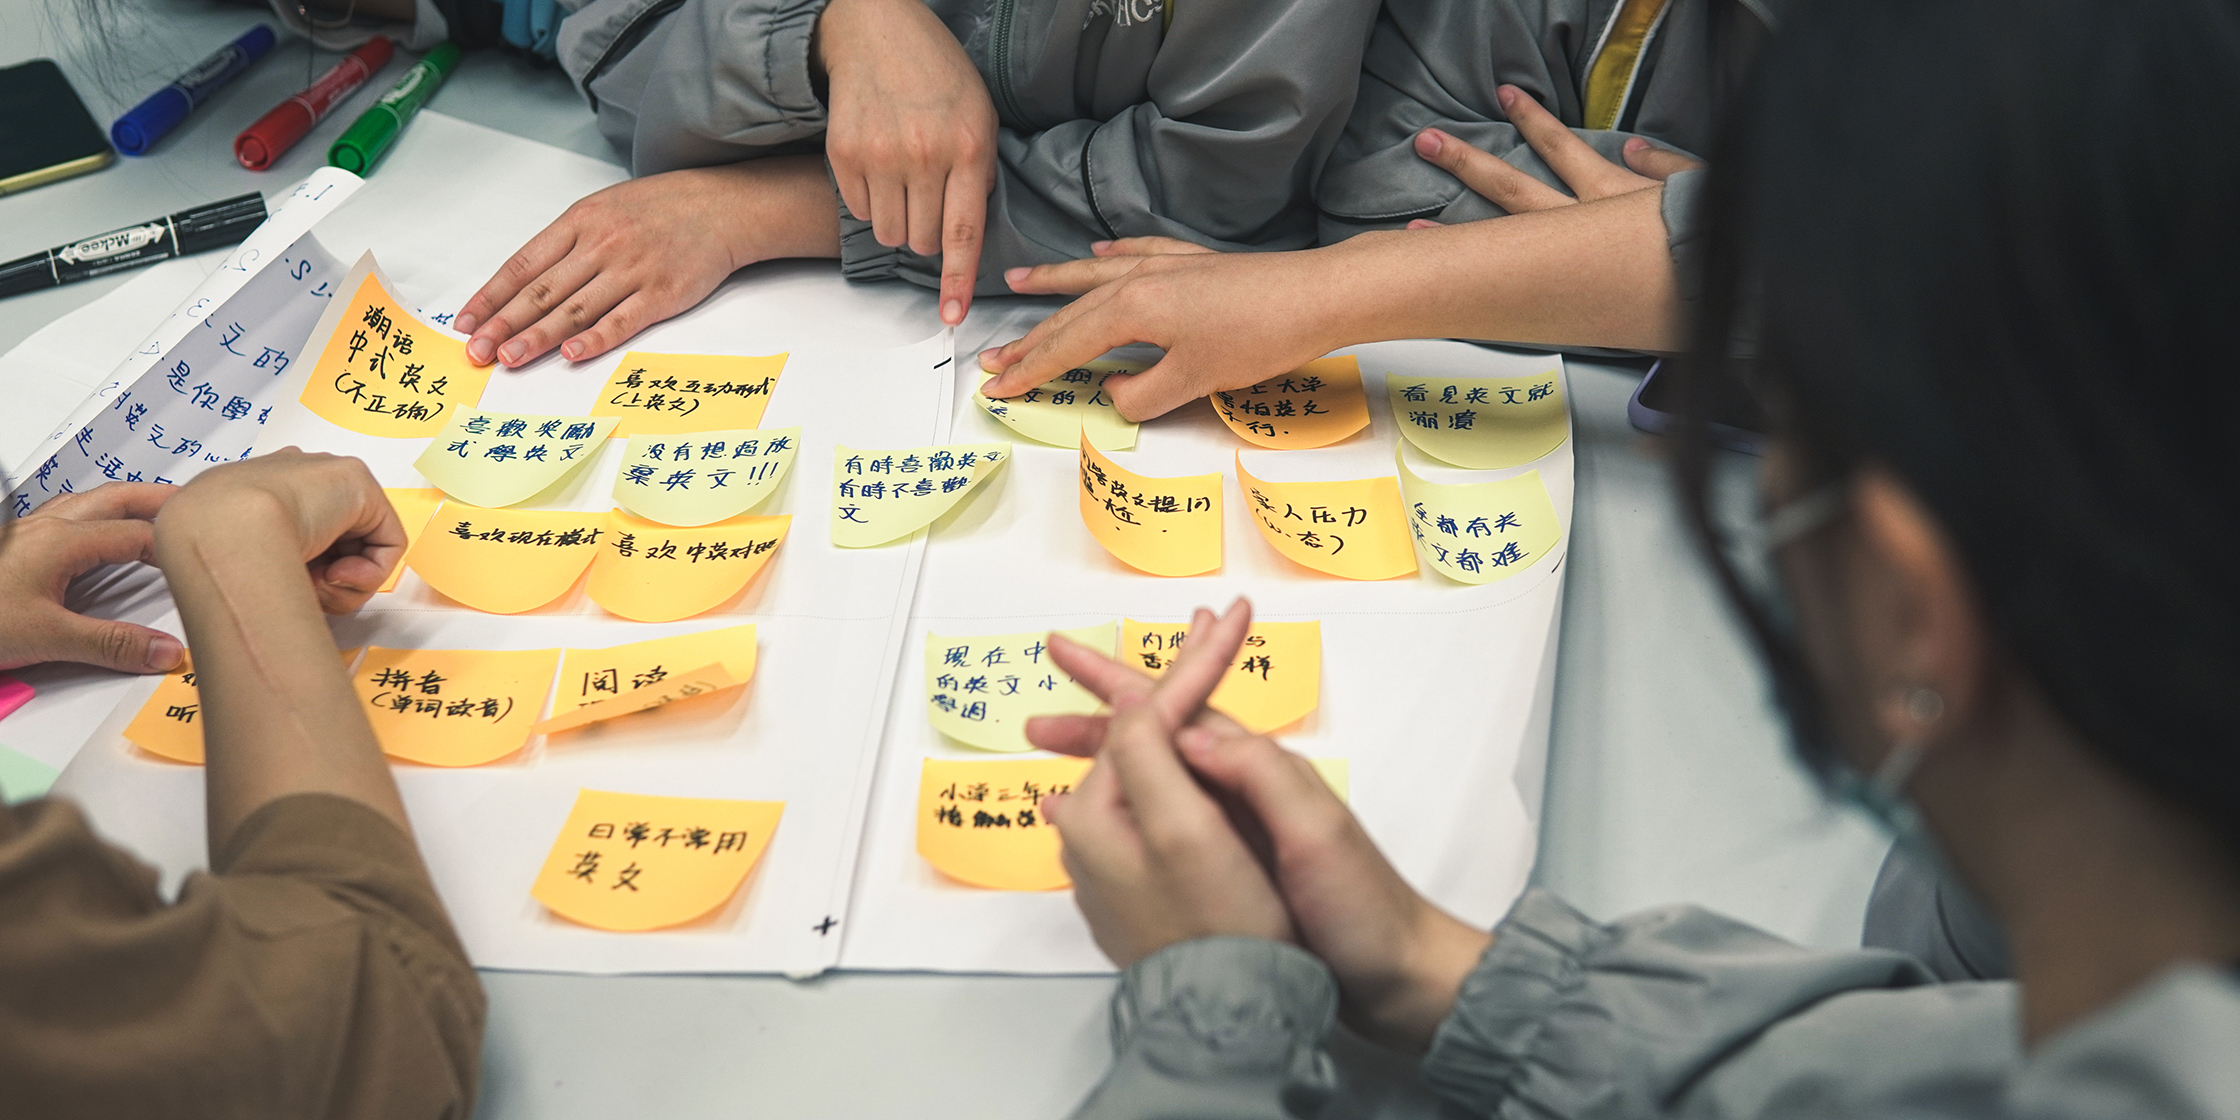
Students cluster abstract concepts in different ways. In the process they also define the concepts that revolve around a particular topic through discussion.
WHY use it?
Students learn how to visualise complex data and also how to understand them visually. The visualisation serves as a new tool and
structure for students to organise their knowledge of the subject content.
Students can learn more about the concepts by negotiating their position in certain frameworks.
HOW to do it?
Try to gather 50+ keywords for a selected topic. This should be done In conjunction with the subject teacher as a key discussion facilitator, to ensure that the keywords used in the class have already been introduced in the subject lesson. Ideally, the students will recall the keywords on their own, as this provides a good opportunity for the activation of prior knowledge.
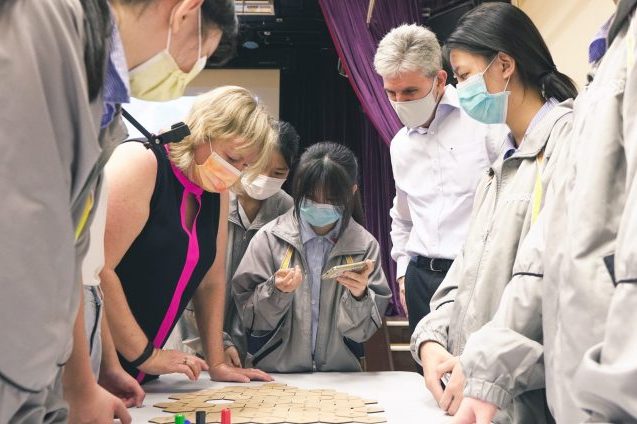
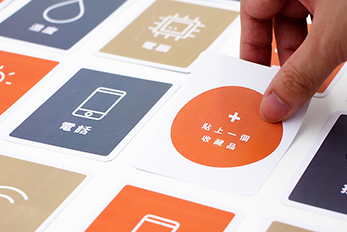
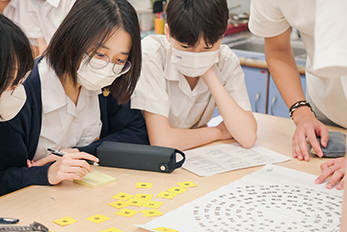
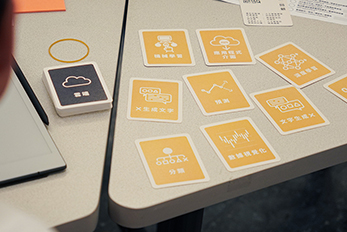
Record each keyword on a separate sticky note.
Explain the goal of the session and the several steps that the students will go through.
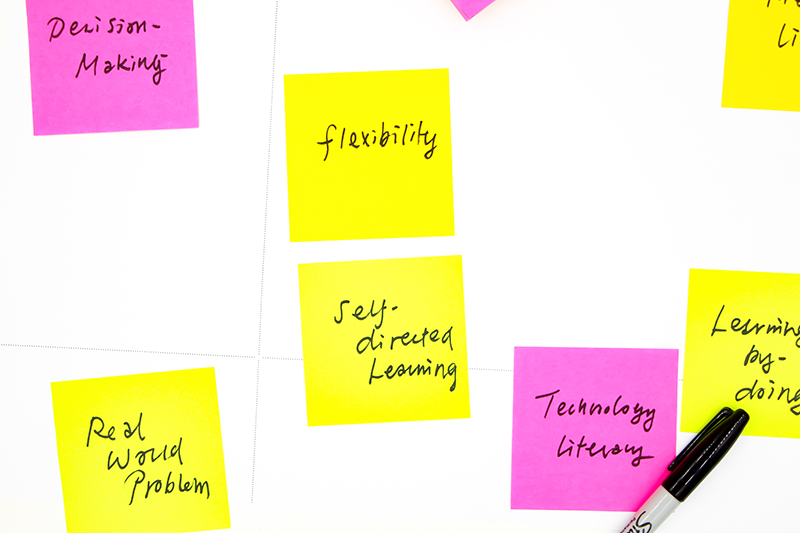
▸ Clustering
Making use of the templates, try to cluster the same set of notes using at least 2 of the following clustering methods:
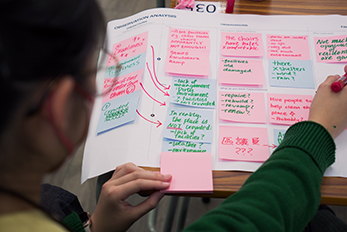
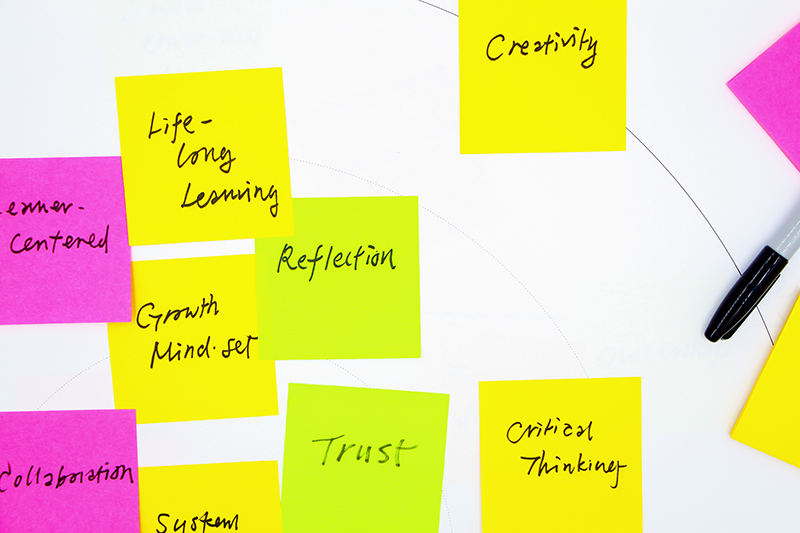
▸ Thematic clustering
Group similar or related sticky notes together to form different clusters. Lead the students to start with small clusters. Name these small clusters and try to group them into bigger ones, and then also give names to these big clusters.
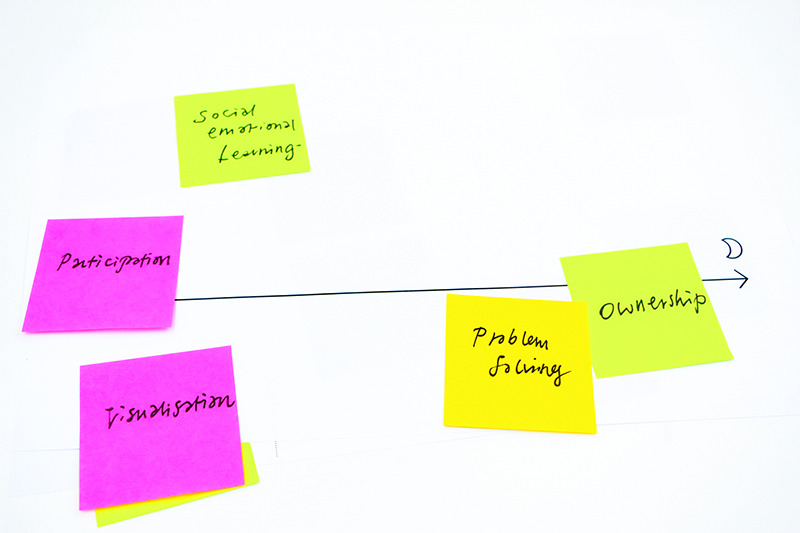
▸ X/Y clustering (analytic)
Label the X and Y axes with different qualities, with the top/ right ends representing the highest amount and the bottom/left ends representing the lowest
Students cluster the keywords relative to the level of the qualities designated to the different axes. Example qualities for the X/Y axis are importance/difficulty (for a problem to solve) and individual/government (for a social issue).
▸ Bull’s eye clustering (relevancy)
Label three concentric circles as ‘primary’, ‘secondary’ and ‘tertiary’ and plot the keywords according to their relevance to the students.
▸ Timeline clustering (correlating/concretising)
Plot the keywords according to the encounter* they have with the concepts/items in a day.
*This task helps students relate abstract concepts to their everyday life, for which facilitators will need to think of a framework. One alternative to the encounter could be the time they think it affects them the most.
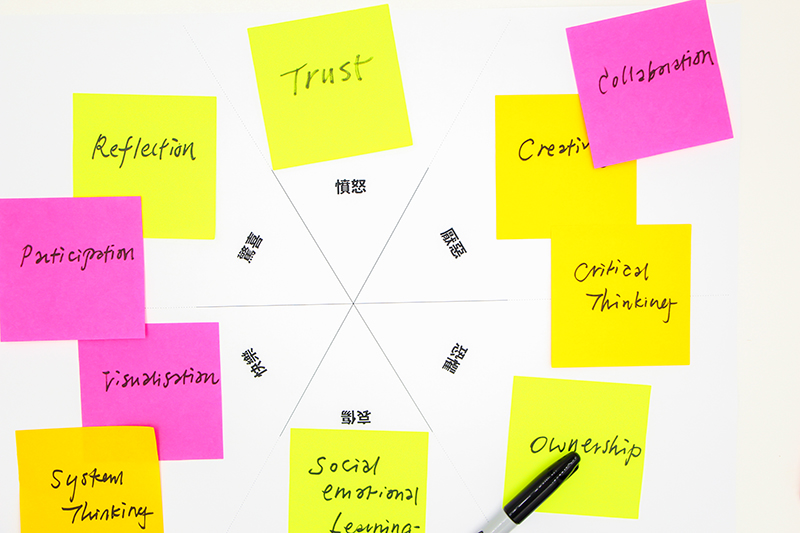
▸ Emotional clustering (perspective)
Students map the keywords according to the emotions related to them. Ekman (2007) lists 6 basic emotions: anger, disgust, fear, happiness, sadness and surprise.
▸ Presentation and debriefing
Teaching Tips
- At the end of the sessions, facilitators should try to narrow down the topic into a sufficiently specific area for observation in the next stage.
- Each group should have their own area if interest. If things are going well, this could be a hypothesis for the group to investigate through observation.