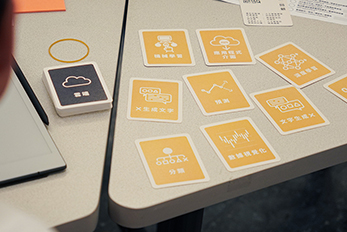
WHAT is it?
Using the data from the Observation, students try to sort the findings to identify and define the needs or openings for design.
WHY teach it?
Students learn how to extract insights from photos.
This task is also a reflection through which the students can consolidate their learning by rigorously reviewing their findings using the framework they set out to follow.
Students also learn to organise data visually.
HOW to do it
▸ Introduction (10mins)
Explain the goal of the session and the several steps that the students will go through.
▸ Getting insights (60mins)
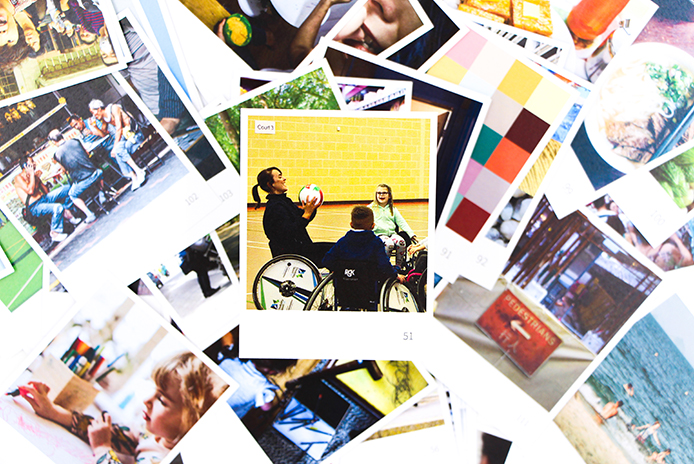
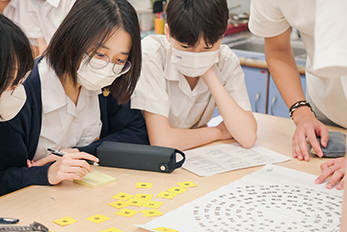
Ask the groups to lay out on the table all of the photos they have taken and to sort them according to the chosen observation framework (e.g., AEIOU, POEMS).
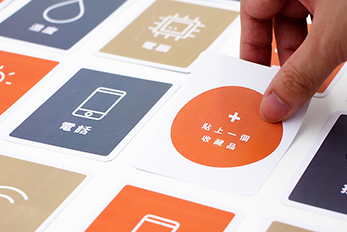
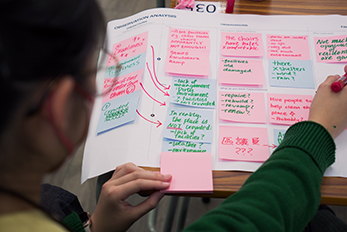
Narrow the observations from the photos into insights, and put each insight on a sticky note.
Re-position photos if necessary.*
*It is best if these tasks are broken into different sessions.
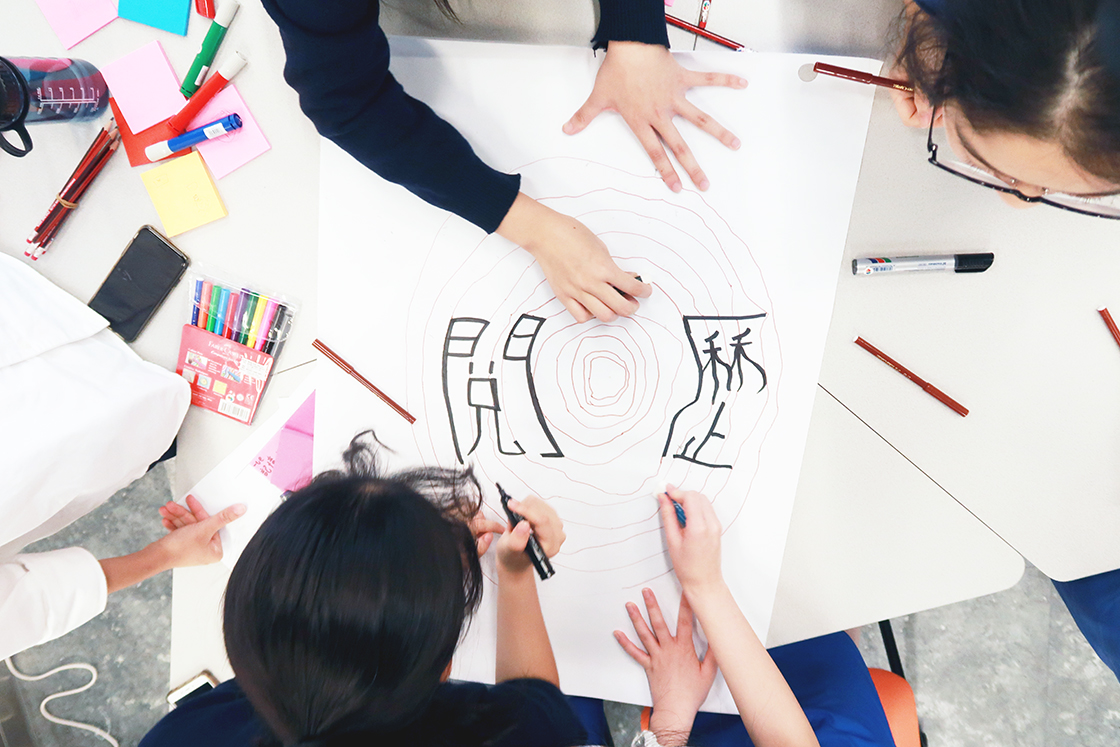
▸ Making the poster (20mins)
Try to the student to make the poster in the format of an infographic.
Introduce some basic concepts of sorting information for visual understanding: reading flow, hierarchy, grouping, colour, etc.
Ask the students to give their poster a title.
▸ Presentation and debriefing (20mins)
